Sources, gaps and data
Raw observations, cleaned selections and narrative stay separate. Missing is never filled in or turned into zero.
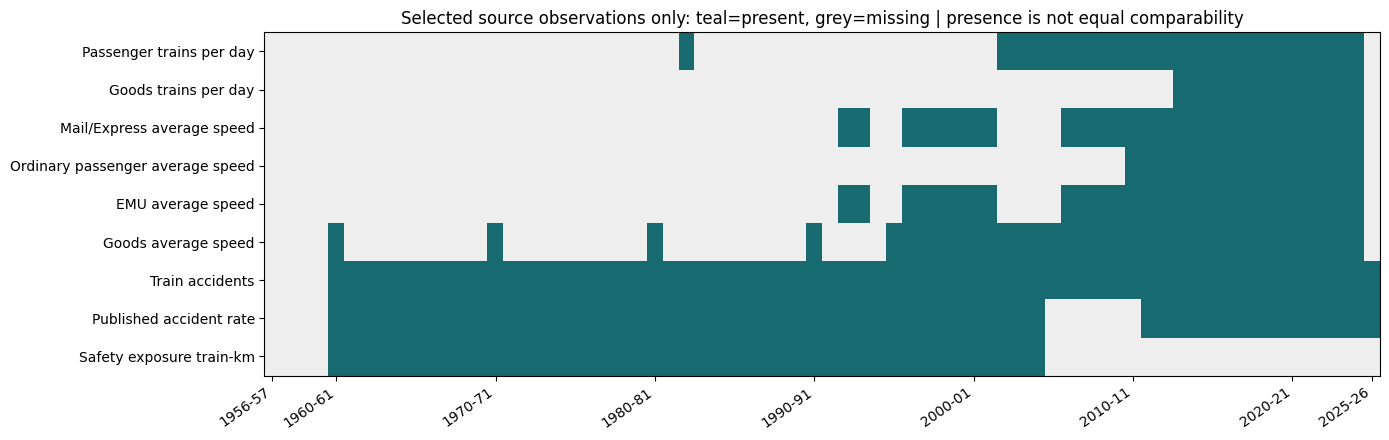
Coverage of the 70-year frame (1956-57 to 2025-26)
| Measure | Years recovered | Of 70 |
|---|---|---|
| Passenger daily services | 1982-83 and 2002-03 to 2024-25 | 24 of 70 |
| Goods daily services | 2013-14 to 2024-25 | 12 of 70 |
| Mail/Express speed | 1992-94, 1996-2002, 2006-07 to 2024-25 | 27 of 70 |
| EMU speed | 1992-94, 1996-2002, 2006-07 to 2024-25 | 27 of 70 |
| Freight speed | Selected early years, then 1995-96 to 2024-25 | 34 of 70 |
| Accident counts | Several reporting regimes, not one series | 66 of 70 |
Download the data
Each file carries its source URLs, date precision and caveats. Use them with the same limits shown on the page.
| Dataset | What it holds | Files |
|---|---|---|
| regional_service_evidence | 11 regional service observations with date, scope and caveat | CSV · JSON |
| milestones | 24 dated milestones, 1956 to 2025, with sources | CSV · JSON |
Full research tables
All 43 tables from the research notebook (release v0.2.1) are on the data catalogue, including the annual frame, 626 observations (475 selected), the source register and the gap register.
Reuse noteKeep each row's source URL, period, scope and QA label. Check reproduction rights before reusing source material in public.