Faster trains, or different averages?
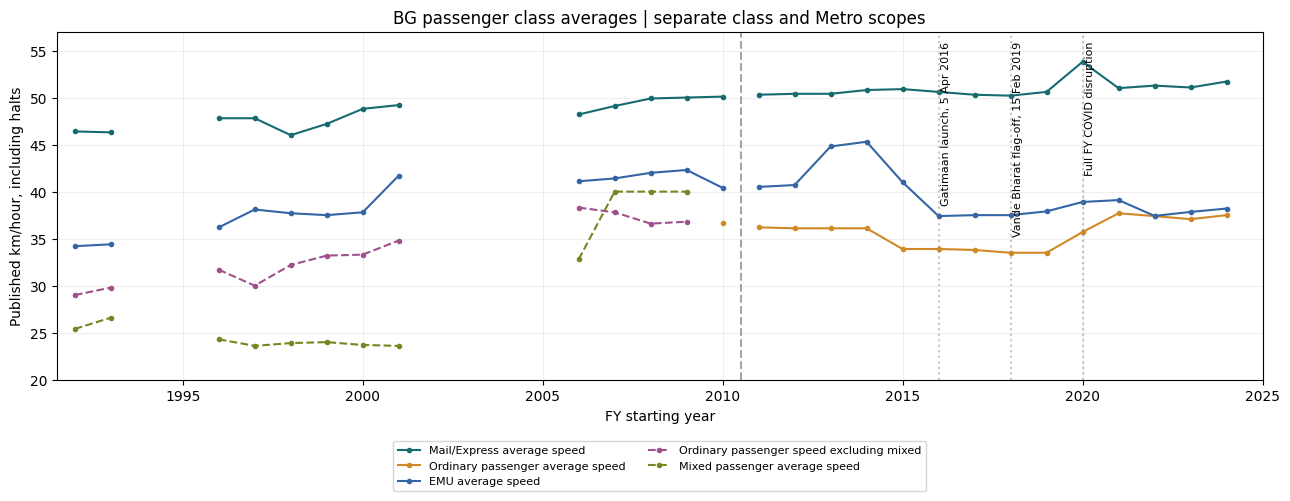
Published Mail/Express average speed changed little over the compared years.
Averages can hide the service mix. These are published class averages, so they cannot show what any one train did.
Data release v0.2.0 recovers three FY2024-25 class-speed cells from the original Year Book: BG Mail/Express 51.7 km/h, EMU 38.2 and ordinary including mixed 37.5. They are overall averages including halts and Kolkata Metro. That lifts Mail/Express and EMU coverage to 27 of 70 years each, and ordinary including mixed to 15 of 70. Top design speed and an individual flagship train are different measures.
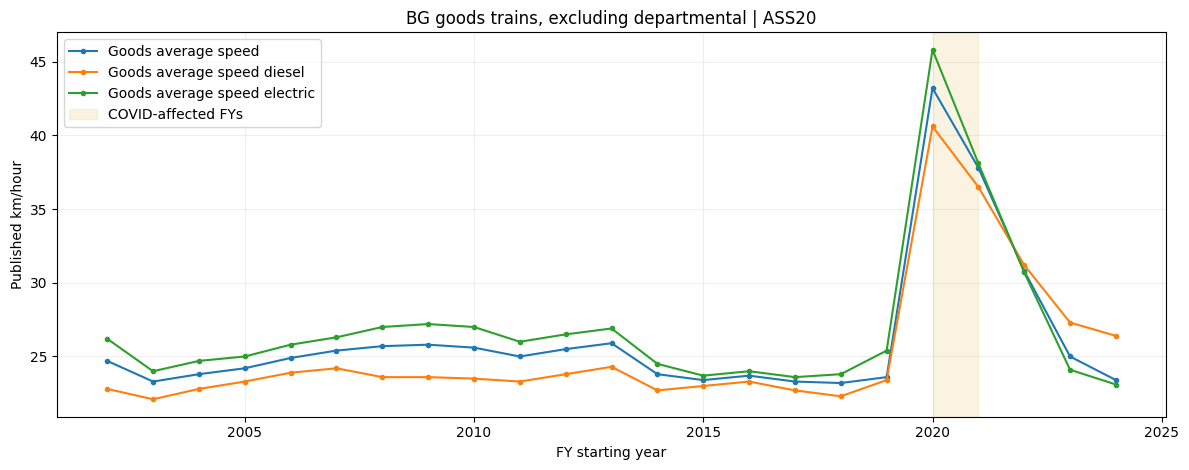
FY2023-24 speeds are printed to one decimal in the newest Year Book and to two in the previous edition. Both vintages are kept. Do not read rounding as a real change. ASS 2024-25 Statement 20 confirms the freight-speed denominator is train-km per train-engine-hour, excluding departmental trains. Whether halt and standing time are counted, and how far the series continues backward, is not settled by that header alone.
For goods speed by zone in 2023-24 and 2024-25 see goods speed by zone. It is a separate table, not a passenger comparison.
Broad-gauge freight speed was 23.6 km/h in 2019-20, 43.2 in 2020-21 and 23.4 in 2024-25. Causes are not established.